On the dashboard: Engagement > Summary
Navigate to the Engagement Tab from the left panel. Summary data is displayed here by default, it includes similar details at the account and project level. The data includes request and response parameters as well as trends over time based based on the selected time frame.
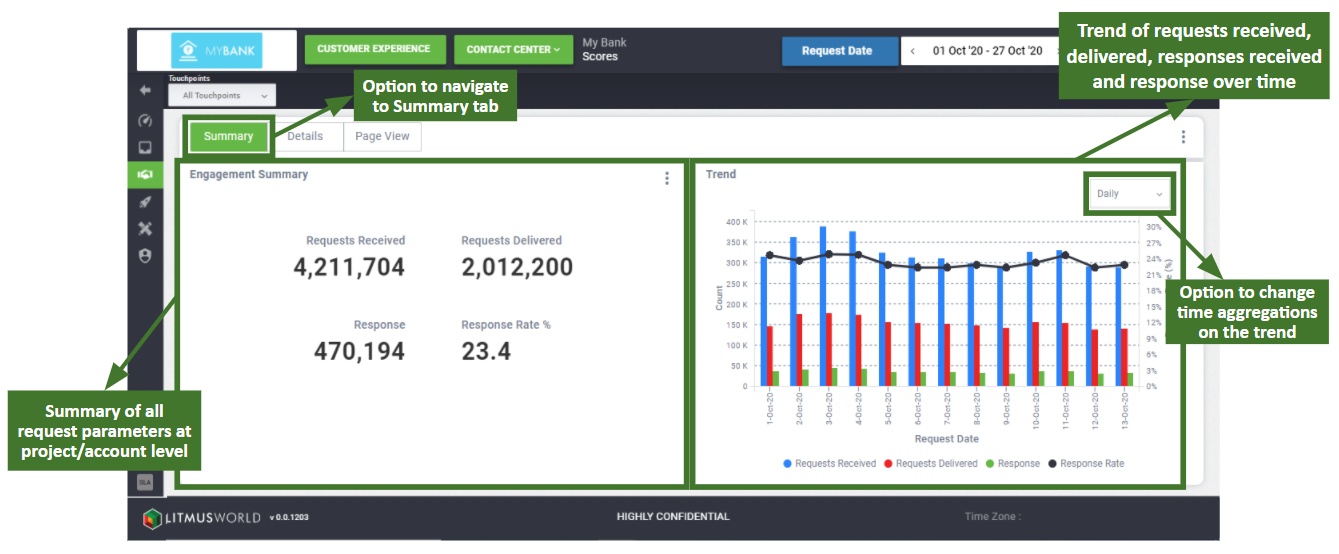
Summary
The left hand side of the summary screen provides an aggregated view of the below mentioned request and response parameters based on the time frame selected using the date picker:
- Requests Received : The total number of requests received against which the conversation links are to be sent out through the channels configured.
- Requests Delivered : Total number of requests against which the conversation link was successfully delivered to the customer through any channel or trial.
- Responses Received : Total number of customers who responded on the conversation link shared to them over any channel or trial
- Response Rate : Percentage of Responses Received out of the total Requests Delivered
Trend
The trend chart on the right side of the screen displays the distribution of request and response parameters based on the selected time frame.
The frequency at which data is aggregated and populated on the trend chart can be switched between weekly, monthly or quarterly levels. The option is available as a dropdown on the top right corner of the widget.
The different options available to plot charts and their availability are as follows:
| Time Aggregation | Details |
| Daily | Plots values on the trend chart by day. Available only if the time frame selected is less than or equal to a month (31 days). |
| Weekly | Plots values on the trend chart aggregated by week (Mon to Sun). Available only if the time frame selected is more than 7 days and less than equal to a year (365 days). |
| Monthly | Plots values on the trend chart aggregated by month. Available only if the time frame selected is more than a month (31 days). |
| Quarterly | Plots values on the trend chart aggregated by quarter (Jan–Mar, Apr–Jun, Jul–Sep, Oct–Dec). Available only if the time frame selected is more than a quarter, or 3 months (92 days). |
| Yearly | Plots values on the trend chart aggregated by year. Available only if the time frame selected is more than a year (365 days). |