On the dashboard: Scores > Quick Insights
Project Level
Leaderboard
Leaderboard
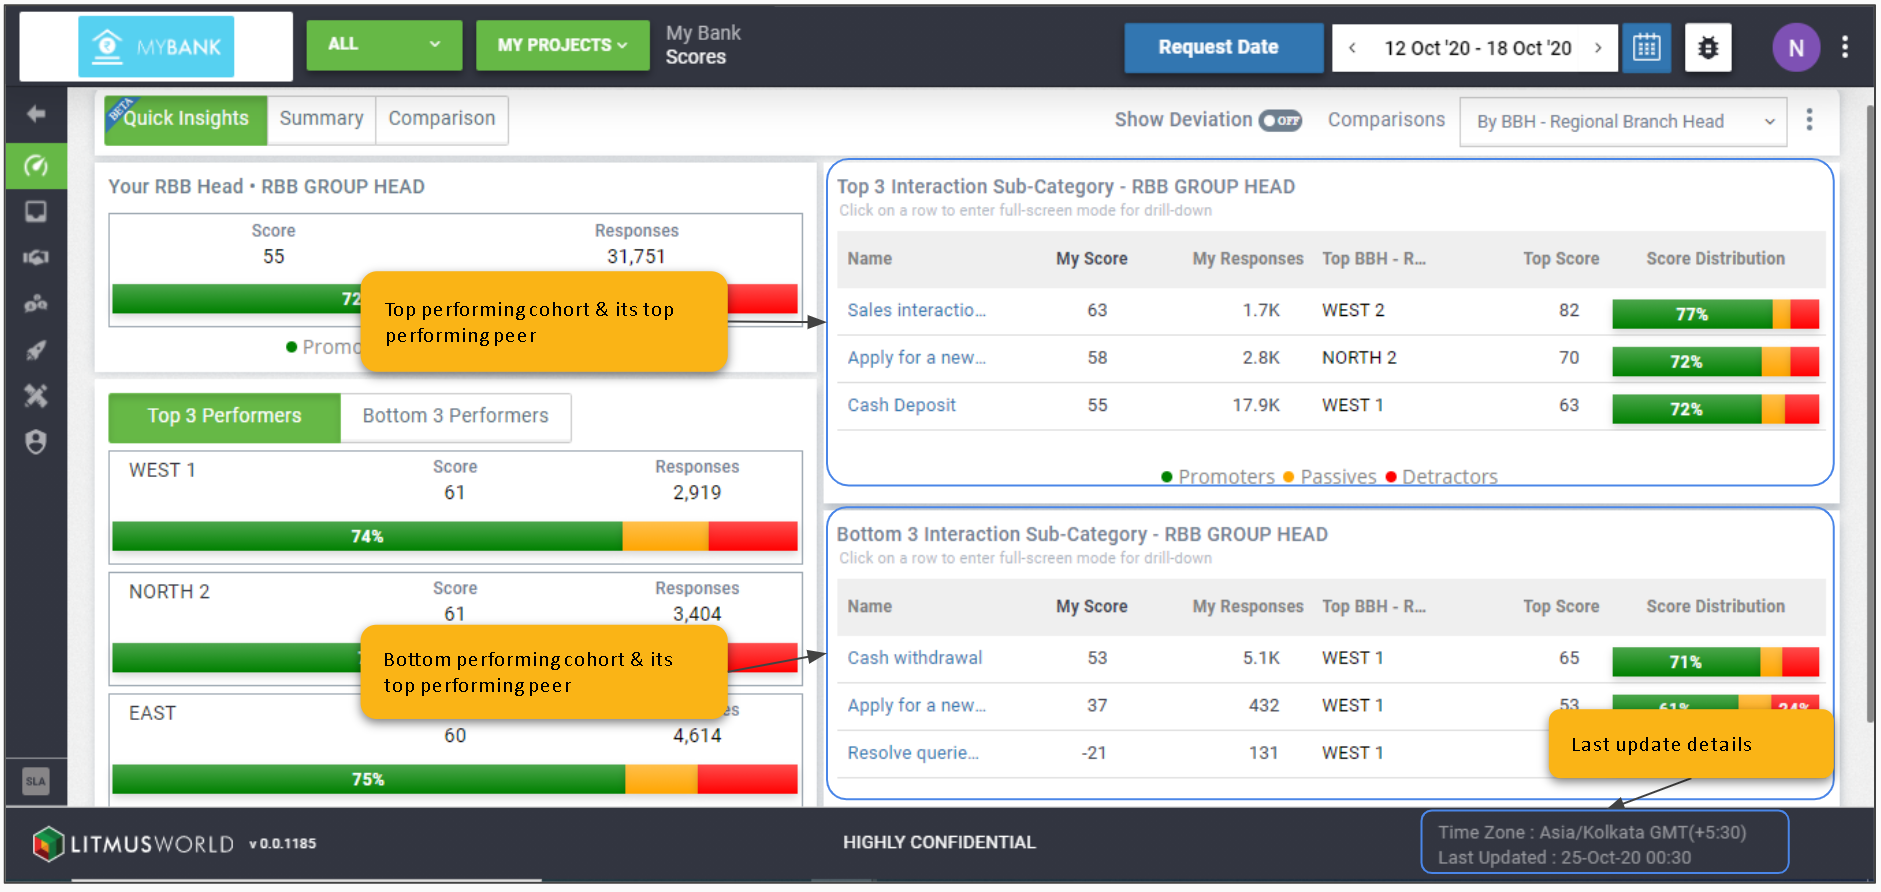
Identifing and recognising top performers – Hierarchy or cohort values whose score or positive impact on the overall score has been the best compared to their peers.
Peer Comparison
The LHS displays score distribution along with a leaderboard of top and bottom performing peers and subordinates across different levels of hierarchy.

Key Performing Areas & Pain Points
The RHS highlights the key performing areas (top cohorts) and pain points (bottom cohort) along with its respective top performing peer. Data on the view is updated daily and is available for the previous weeks/months/quarters/years.